FlowmapBlue
FlowmapBlue
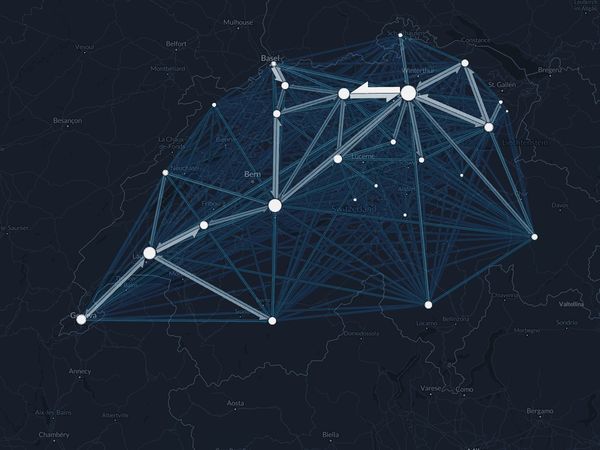
地点間の移動量を表す地理的フローマップを作成できます。
Google Sheets に公開した独自の OD データを可視化しましょう。
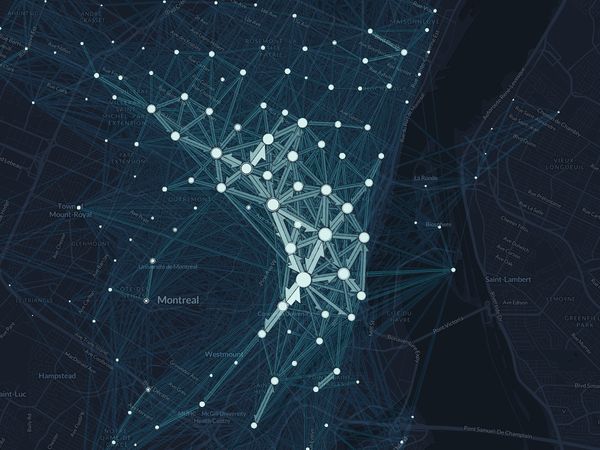
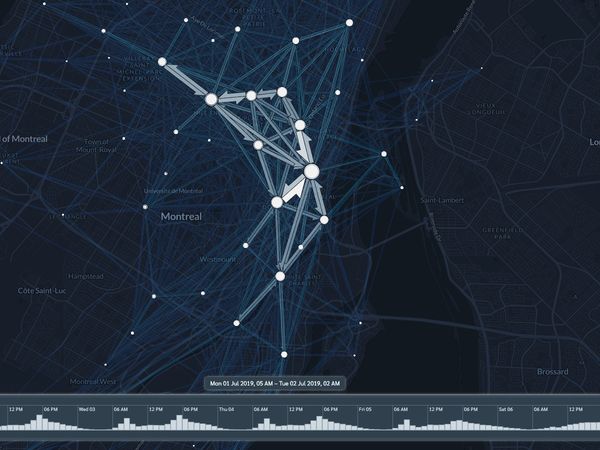
インタラクティブにデータを探索できます。
何に使える?
FlowmapBlue は、地点のペアが関わるさまざまな現象を可視化するために使われています。
都市モビリティ通勤・通学歩行者の動きバス移動地下鉄利用鉄道利用航空移動海上交通自転車シェアスクーターシェアライドシェアタクシー国内移住国際移住難民の移動人身取引麻薬の流通貨物輸送物質の流れ貿易鳥の渡り家畜の移動植物の移入都市インフラ下水の流れ廃棄物管理サプライチェーン疫学歴史的な旅路科学研究の協働


誰が使っている?


フローマップの作り方
手順は このページでご確認ください。
最新情報
Sept 1, 2023
Releasing Flowmap City, the new product we are building. It offers secure data storage, more analytics capabilities, improved scalability, an SQL query editor, and more coming. Check it out here.
Jun 28, 2022
Sep 01, 2021
Feb 25, 2021
Jul 01, 2020
Credits
Developed by Ilya Boyandin using deck.gl, flowmap.gl, mapbox, d3, blueprint, CARTOColors.
With kind support from


Open Source
FlowmapBlue source code is free non-commercial usage. If you want to use it in a commercial project, please reach out to us.
This work is licensed under a Creative Commons Attribution-NonCommercial 4.0 International License.


Please make sure to include proper attribution. Use one of these images and link them to the FlowmapBlue website:


Awards
